City Ranking 2026: Free to Breathe

How clean is the air in your city?

All of us should be free to breathe clean air, wherever we live. Yet millions of us continue to breathe polluted air, putting our health and wellbeing at risk.

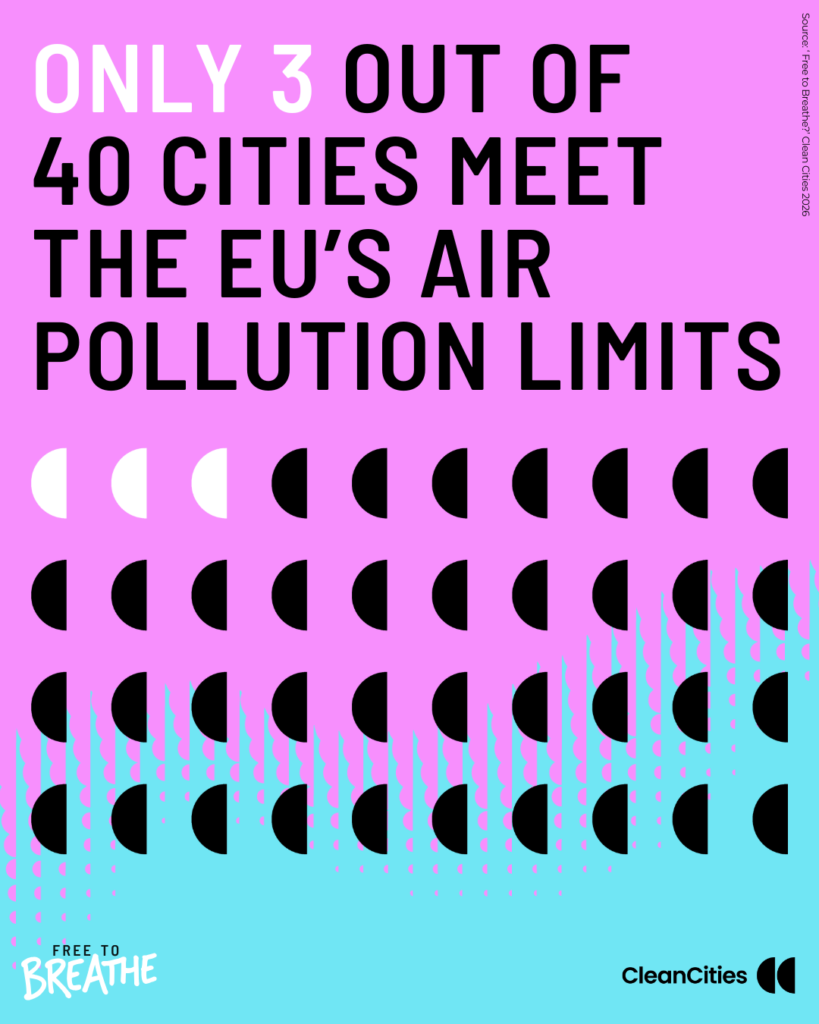
Clean Cities has analysed 40 major European cities to find out their progress on tackling air pollution and whether they meet the EU’s new, tougher air quality limits for nitrogen dioxide (NO2) and fine particulate matter (PM2.5) – two of the most harmful pollutants from road transport.

Keep scrolling to see how your city ranks.

OVERALL RESULTS

INDICATORS WE LOOKED AT:

Three-year mean concentration

Score based on city-wide mean concentration of NO₂ and PM2.5 from 2023–2025, with 0 points for levels above current AAQD limits and 10 points for levels at or below WHO guidelines.

AAQD compliance

Score based on city-wide pass/fail assessments against the revised AAQD daily and annual limits for NO₂ and PM2.5 , including permitted daily exceedances. Compliance is determined by the worst-performing monitoring station in the city.

Relative change

Score based on the percentage reduction in city-level mean NO₂ and PM2.5 concentrations between 2016–18 and 2023–25.

Policy measures

Score based on the implementation of four clean transport measures proven to reduce air pollution: low- and zero-emission zones, bus electrification, protected cycling infrastructure and school streets.

#

City

Country

Total score

Grade

3-year mean concentration

AAQD compliance

Relative
change

Policy
measures

1
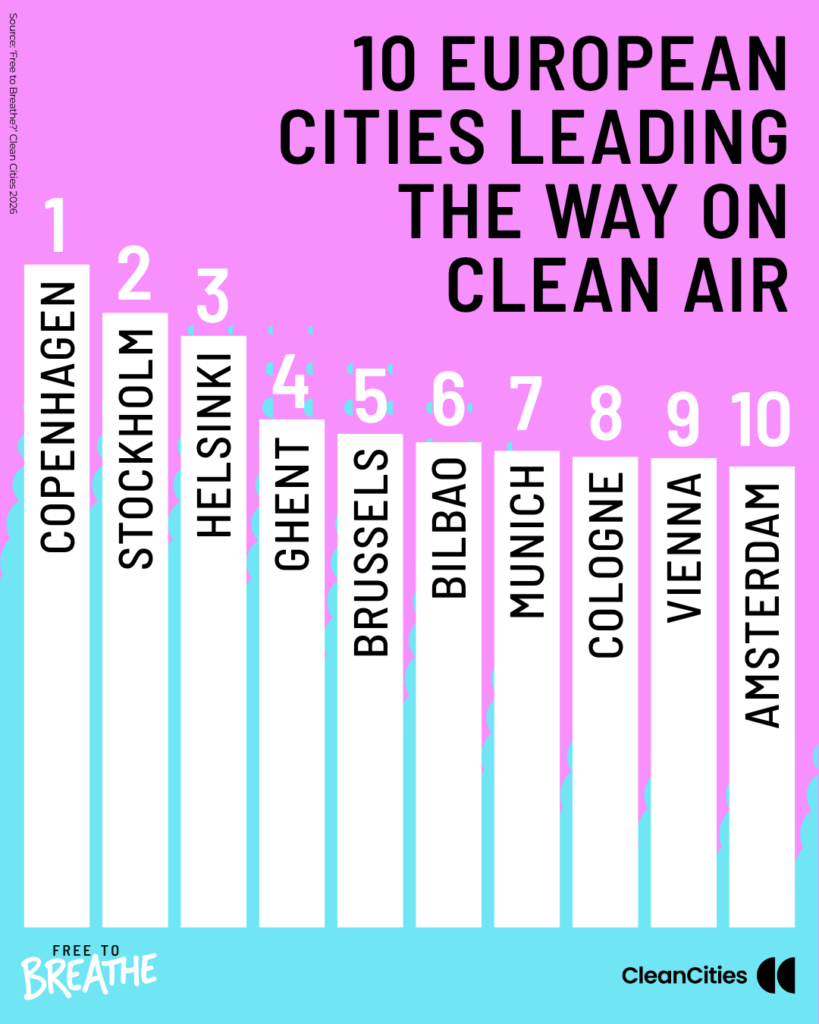
Copenhagen
Denmark
91.3%
A
90.3%
100%
87.0%
90.0%
2
Greater Stockholm
Sweden
84.7%
A
99.3%
100%
61.0%
50.0%
3
Greater Helsinki
Finland
81.5%
A
98.0%
100%
55.0%
40.0%
4
Ghent
Belgium
70.0%
B
75.0%
50.0%
75.0%
70.0%
5
Brussels-Capital Region
Belgium
68.0%
B
71.7%
50.0%
73.0%
70.0%
6
Bilbao
Spain
66.8%
B
77.7%
75.0%
53.0%
40.0%
7
Munich
Germany
65.7%
B
68.0%
50.0%
80.0%
60.0%
8
Cologne
Germany
64.8%
C
69.3%
50.0%
71.0%
60.0%
9
Vienna
Austria
64.7%
C
71.7%
50.0%
63.0%
60.0%
10
Greater Amsterdam
Netherlands
63.5%
C
74.0%
0%
68.0%
90.0%
11
Berlin
Germany
60.2%
C
70.3%
25.0%
75.0%
50.0%
11
Hamburg
Germany
60.2%
C
67.3%
50.0%
68.0%
40.0%
13
Greater Lisbon
Portugal
59.8%
C
73.0%
50.0%
71.0%
20.0%
13
Stuttgart
Germany
59.8%
C
68.3%
25.0%
79.0%
50.0%
15
Oslo
Norway
58.2%
C
82.7%
0%
61.0%
40.0%
16
Greater London
United Kingdom
56.8%
C
66.7%
0%
72.0%
70.0%
17
Valencia
Spain
56.7%
C
77.3%
25.0%
53.0%
30.0%
18
Barcelona
Spain
56.5%
C
60.7%
50.0%
58.0%
50.0%
19
Bratislava
Slovakia
55.5%
C
73.3%
25.0%
68.0%
20.0%
20
Dublin
Ireland
55.3%
C
78.7%
50.0%
27.0%
20.0%
21
Antwerp
Belgium
55.2%
C
63.0%
0%
61.0%
80.0%
22
Florence
Italy
54.2%
D
61.7%
50.0%
50.0%
40.0%
23
Lyon
France
53.8%
D
62.7%
0%
65.0%
70.0%
24
Greater Paris
France
51.3%
D
58.7%
0%
72.0%
60.0%
25
Marseille
France
50.5%
D
58.0%
25.0%
64.0%
40.0%
26
Madrid
Spain
49.8%
D
64.3%
25.0%
42.0%
40.0%
27
Bologna
Italy
48.3%
D
53.7%
25.0%
54.0%
50.0%
28
Sofia
Bulgaria
48.2%
D
63.3%
0%
69.0%
30.0%
29
Ljubljana
Slovenia
45.0%
D
53.0%
25.0%
66.0%
20.0%
30
Budapest
Hungary
42.7%
E
60.0%
0%
56.0%
20.0%
31
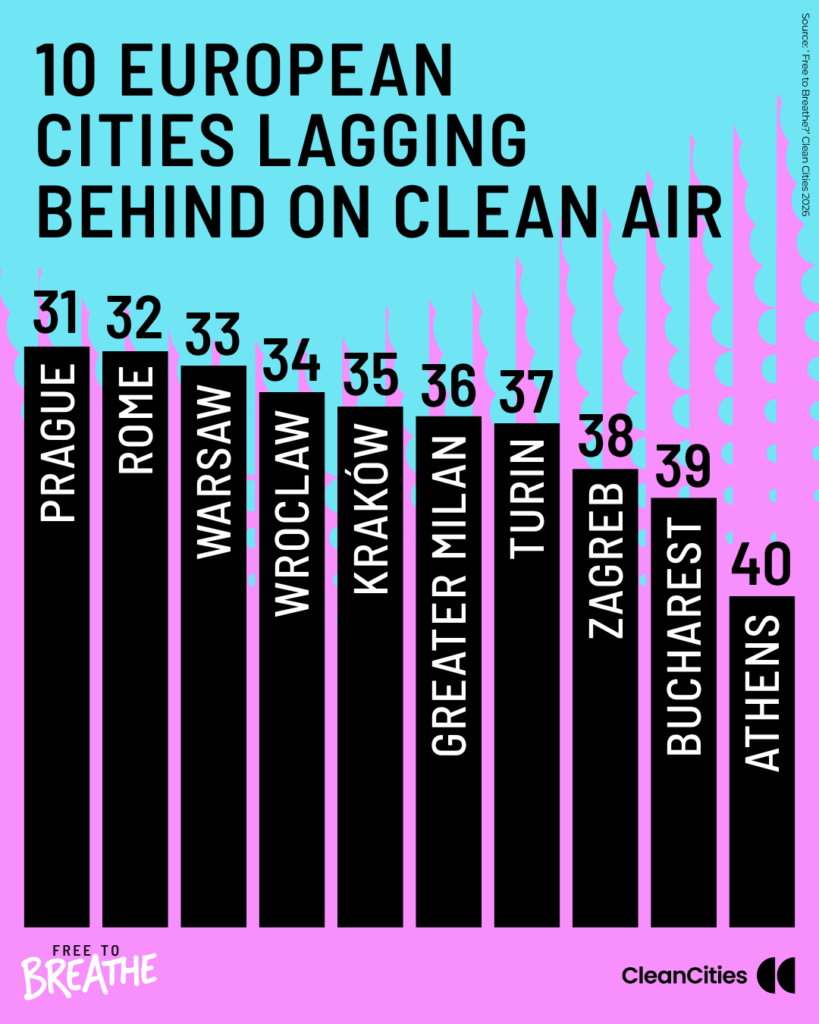
Prague
Czechia
40.3%
E
59.3%
0%
54.0%
10.0%
32
Rome
Italy
40.0%
E
49.0%
0%
53.0%
40.0%
33
Warsaw
Poland
39.0%
E
43.0%
0%
55.0%
50.0%
34
Wroclaw
Poland
37.2%
E
46.3%
0%
53.0%
30.0%
35
Kraków
Poland
36.2%
E
34.7%
0%
73.0%
40.0%
36
Greater Milan
Italy
35.5%
E
29.3%
0%
54.0%
70.0%
37
Turin
Italy
35.0%
E
26.7%
0%
59.0%
70.0%
38
Zagreb
Croatia
31.8%
E
45.3%
0%
45.0%
10.0%
39
Bucharest
Romania
29.8%
F
36.0%
0%
51.0%
20.0%
40
Athens
Greece
23.0%
F
33.7%
0%
27.0%
10.0%

DOWNLOAD THE full research

Want the complete findings, insights and methodology? Download the full report and data below.

JOIN US

The EU recently set stricter air pollution limits – but this ranking shows that 93% of European cities exceed them. National governments and cities must urgently work together to clean up our air.

Our new campaign, Free to Breathe, calls on politicians to meet the EU’s air quality limits. Find out more and sign our petition today.

Spread the word

Use the materials below on social media using the #CityRanking hashtag – don’t forget to tag your city leaders!

Share the results:

Data for indicators 1-3 was sourced from the European Environment Agency’s Annual Air Quality Statistics database. Data for indicator 4 was compiled by Clean Cities from publicly available sources. We have made every effort to ensure the data is reliable and comparable.

  • For each of the four indicators, cities received a score from 0 (lowest) to 10 (highest) points.
  • Because current pollution levels matter most for residents’ health, the score for the first indicator (three-year mean concentration) was given triple weight (30 points), giving a maximum total of 60 points.
  • The score was then converted into a percentage, with the maximum score corresponding to 100%.
  • Based on their overall score, cities are assigned a rank from 1 (highest score) to 40 (lowest score). Grades from A (best score) to F (worst score) were assigned based on the percentage score received.


For more information on our methodology, please refer to Annex 3 in the report.
ISCRIVITI AI NOSTRI AGGIORNAMENTI
La Campagna Clean Cities utilizzerà le informazioni da te fornite per contattarti in merito ai suoi prodotti e servizi. È possibile annullare l'iscrizione a queste e-mail in qualsiasi momento.