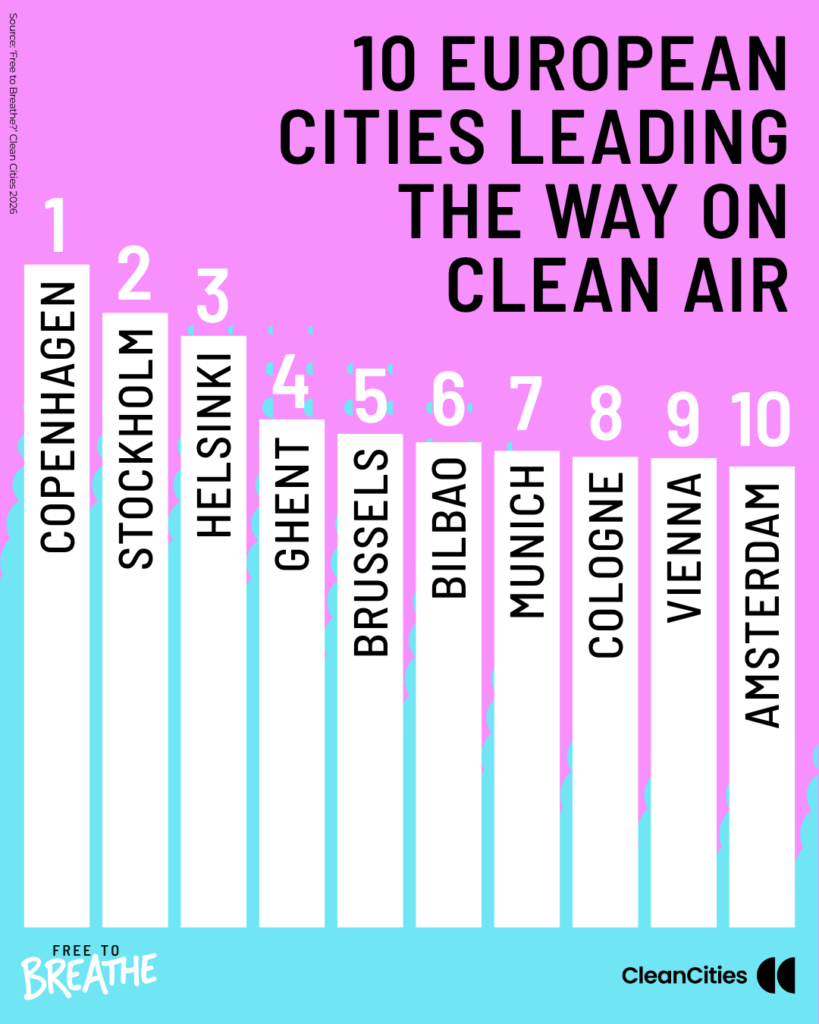
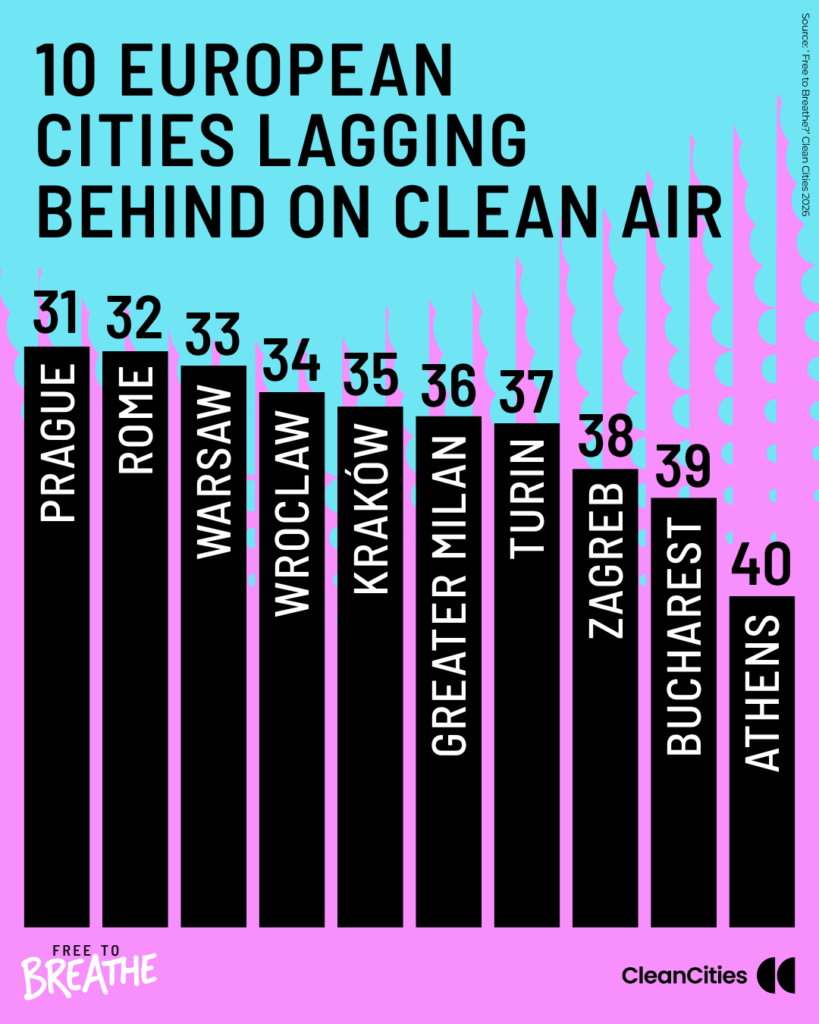
All of us should be free to breathe clean air, wherever we live. Yet millions of us continue to breathe polluted air, putting our health and wellbeing at risk.
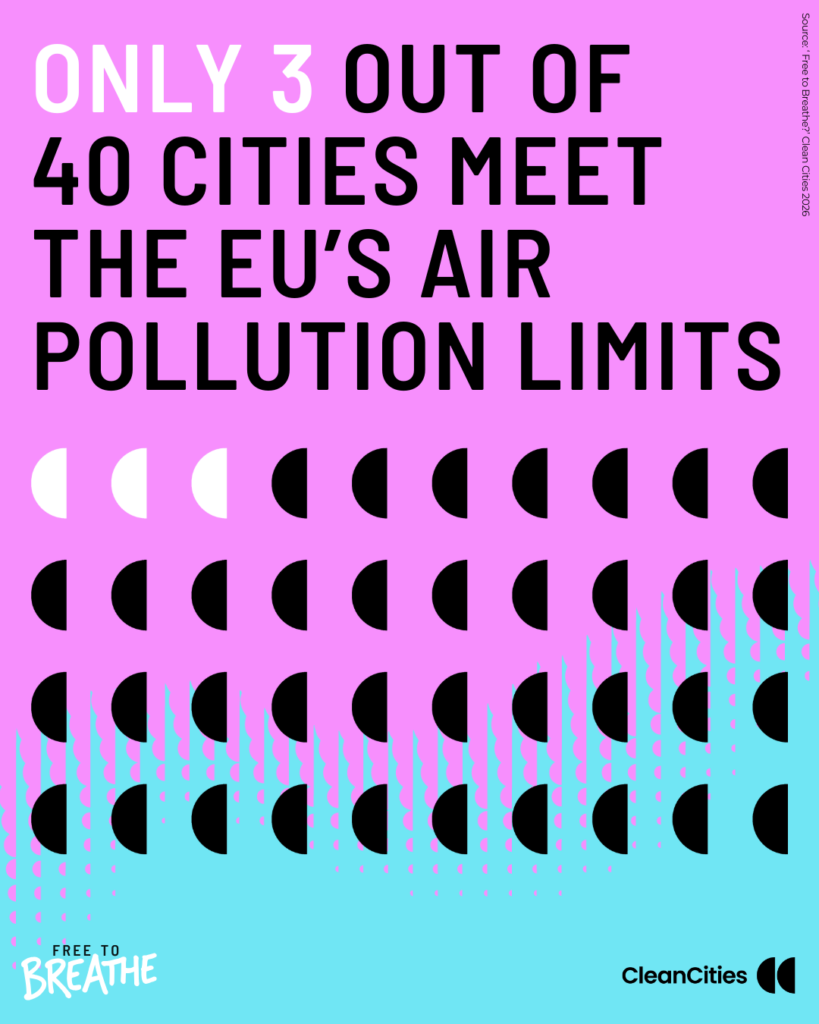
Clean Cities has analysed 40 major European cities to find out their progress on tackling air pollution and whether they meet the EU’s new, tougher air quality limits for nitrogen dioxide (NO2) and fine particulate matter (PM2.5) – two of the most harmful pollutants from road transport.
Keep scrolling to see how your city ranks.
Score based on city-wide mean concentration of NO₂ and PM2.5 from 2023–2025, with 0 points for levels above current AAQD limits and 10 points for levels at or below WHO guidelines.
Score based on city-wide pass/fail assessments against the revised AAQD daily and annual limits for NO₂ and PM2.5 , including permitted daily exceedances. Compliance is determined by the worst-performing monitoring station in the city.
Score based on the percentage reduction in city-level mean NO₂ and PM2.5 concentrations between 2016–18 and 2023–25.
Score based on the implementation of four clean transport measures proven to reduce air pollution: low- and zero-emission zones, bus electrification, protected cycling infrastructure and school streets.
#
City
Country
Total score
Grade
3-year mean concentration
AAQD compliance
Relative
change
Policy
measures
Want the complete findings, insights and methodology? Download the full report and data below.
The EU recently set stricter air pollution limits – but this ranking shows that 93% of European cities exceed them. National governments and cities must urgently work together to clean up our air.
Our new campaign, Free to Breathe, calls on politicians to meet the EU’s air quality limits. Find out more and sign our petition today.
Use the materials below on social media using the #CityRanking hashtag – don’t forget to tag your city leaders!
Share the results:
Data for indicators 1-3 was sourced from the European Environment Agency’s Annual Air Quality Statistics database. Data for indicator 4 was compiled by Clean Cities from publicly available sources. We have made every effort to ensure the data is reliable and comparable.
For more information on our methodology, please refer to Annex 3 in the report.